I report here on a recent, privately-conducted knowledge management survey of large law firms.
Survey Background and Questions. This survey is conducted annually in December to prepare for a meeting of KM professionals to discuss KM trends, issues, and opportunities. The co-organizers (Mary Abraham, Oz Benamram, and I) survey invitees about their KM priorities and interests. We ask three questions; the quoted text in parens corresponds to chart labels below:
- What are your top priorities for 2015? (“2015 Priority”)
- What did you focus on in 2014? (“2014 Focus”)
- What would you like to discuss with the group in 2015? (“2015 Discuss”)
Survey Demographics and Qualifiers
- Year-to-Year Comparisons May Not be Reliable: About 70 KM professionals responded in 2015 compared to 55 in 2014 and 75 in 2013. Because the number and mix of respondents change annually, year-to-year results do not compare identical populations. Drawing definitive conclusions about trends is therefore risky.
- Firm Sizes and Locations: Across years, most respondents are from firms with 500 or more lawyers. The bulk of responses are from firms in the US, Canada, and the UK but with some from other countries.
- Multiple Answers Allowed: Because we allow multiple choices per answer – and, in fact, many respondents chose several – percents do not add up to 100. Moreover, as explained in more detail below, respondents selected more choices in 2015 than 2014, which makes comparisons across time even more difficult.
- Respondents Provide Free-Form Text Answers and Answer Tags: Respondents answer with free-form text and categorize their answers into one or more of 16 defined topics (tags). In 2014, we had 17 topics. We eliminated one 2014 tag, “culture and change management”, because we realized it overlapped significantly with “selling and marketing KM”. In 2013, we had 12 tags, all of which carried forward in 2014 and 2015.
- All Charts Now List Topics in the Same Order. In prior years, I sorted graphs to show highest ranking answers. I decided not to do so this year so it would be easier to compare graphs visually.
2015 Responses: KM Priority, Focus, and Discuss
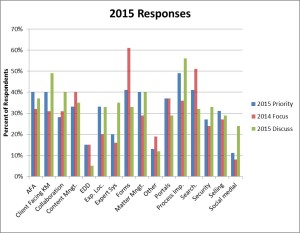
This chart shows responses to the 2015 survey:

The variation in percent of respondents for both priority and focus across topics this year is smaller than it was last year. With some exception, the answers this year cluster between 20% and 40%; in contrast, last year several were well below 20%. As for exceptions, eDiscovery (EDD) is always low because only a few KM professionals are responsible for it. Social media is chronically low because of past failures. I speculate about the seeming reduction in variance below.
KM Priorities Across Years
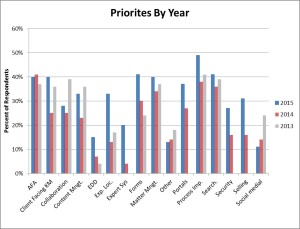
The chart below offers a longitudinal view, comparing priorities across three years:

Reviewing this, I immediately noticed significant increases this year across most topics versus last year. This could mean that KM departments have grown and so do more. Or it could mean they spread limited resources more thinly. Neither explanation particularly appealed to me so I dug deeper into the data.
The 2015 number (rather than percent) of responses per topic in 2015 is up significantly from 2014. In 2015 respondents selected 5.3 answers on average in contrast to 3.6 for 2014. That increase of almost two means, arithmetically, that the average percent responders goes up. This likely also explains why we see less dispersion in the overall 2015 responses above.
How can we interpret these data? Reading the many free-form text comments provides no further insight. So to explain, I am left to speculate a bit, based on my experience. My view is that firms are now more actively working to improve the value they offer clients…
Note that the AFA responses are flat but process improvement is up. Simply recasting hourly billing with AFA or budgets does not create value. To deliver better value, firms must work differently. The jump in process may signal recognition of that fact. Likewise, the jump in responses for client-facing KM and expert systems are consistent with delivering more value.
Even the particularly big jumps in traditional KM – experience management, forms, portals, and selling KM – may reflect efforts to deliver more value. (It could, in fairness, also reflect regression to the mean after a few years of focus on AFA, pricing, and other newer initiatives.)
The leap in security is no surprise given 2014 news. Nor is the decline in social media a surprise; sadly, few firms have achieved much success with it.
Did We Act on What We Said Our KM Priorities Would Be?
In prior survey reports, I compared the “going in” priorities from the prior year’s survey with what respondents reported they actually focused on in the current year. Because of the marked increase in number of topics selected per respondent in 2015 versus 2014 (as reported above), I do not believe this comparison is valid this year. (Pause here a moment to consider how many legal market surveys fail to even report demographics much less point out where results may not be meaningful.)
2015 Priorities Compared to Discussion Interests
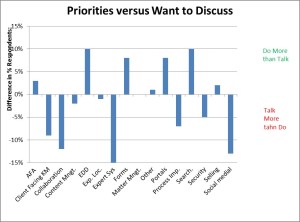
Each year we also compare what respondents say they will actually do (priorities) with what they would like to discuss. Previously, I used a scatter chart because there were only one or two visible outliers. The data line up differently this year and so I have switched to a bar chart:

In my view, these data reflect reality versus aspiration. I’ll comment on gaps of more than 5%. Let’s start with the positive number, which mean “do more than talk”. EDiscovery is a bit of an outlier because only some are responsible for it. I suspect that those respondents recognize we are not the best group for a deep dive on the topic.
Three traditional KM pursuits – forms / precedents, portals, and search – have gaps of 8 to 10%. One interpretation is that all three are long-standing KM tools that we have discussed so much in years past that there is less to say now. In my view, however, the combination of portals and search are becoming more interesting. As the underlying technologies improve, it is possible to combine the two deliver information to lawyers by role (persona) and even task.
The negative numbers – “talk more than do” – are perennials. Client-facing KM, better collaboration, commercialized expert systems, process improvement, and social media are long-standing but hard to achieve goals. The group consistently works to find the best approaches to and learn from each other on these topics. Furthermore, all are newer too and so still hold more interest. Separately, security and access have rapidly become hot topics and I suspect many would like to learn more before they have to act.
* * *
I welcome comments or observations on legal KM trends.
Archives
Blog Categories
- Alternative Legal Provider (44)
- Artificial Intelligence (AI) (57)
- Bar Regulation (13)
- Best Practices (39)
- Big Data and Data Science (14)
- Blockchain (10)
- Bloomberg Biz of Law Summit – Live (6)
- Business Intelligence (21)
- Contract Management (21)
- Cool Legal Conferences (13)
- COVID-19 (11)
- Design (5)
- Do Less Law (40)
- eDiscovery and Litigation Support (165)
- Experience Management (12)
- Extranets (11)
- General (194)
- Innovation and Change Management (188)
- Interesting Technology (105)
- Knowledge Management (229)
- Law Department Management (20)
- Law Departments / Client Service (120)
- Law Factory v. Bet the Farm (30)
- Law Firm Service Delivery (128)
- Law Firm Staffing (27)
- Law Libraries (6)
- Legal market survey featured (6)
- Legal Process Improvement (27)
- Legal Project Management (26)
- Legal Secretaries – Their Future (17)
- Legal Tech Start-Ups (18)
- Litigation Finance (5)
- Low Cost Law Firm Centers (22)
- Management and Technology (179)
- Notices re this Blog (10)
- Online Legal Services (64)
- Outsourcing (141)
- Personal Productivity (40)
- Roundup (58)
- Structure of Legal Business (2)
- Supplier News (13)
- Visual Intelligence (14)
