Each year, Mary Abraham, Oz Benamram and I organize a meeting of global legal KM professionals to discuss trends, issues, and opportunities. In prep for it, we conduct a survey of invitees in November, December, and January. We use the survey to build our agenda, share some results publicly, and provide respondents with detailed results. I report here on 2016 knowledge management priorities in large law firms.
1 About this Survey
We ask three primary questions; the quoted text in parentheses corresponds to chart labels and legends that appear later this this report.
- What are your top priorities for 2016? (“2016 Priority”)
- What did you focus on in 2015? (“2015 Focus”)
- What would you like to discuss with the group in 2016? (“2016 Discuss”)
1.2 Survey Demographics and Caveats about Interpreting It
Too few published legal market surveys clearly specify respondent demographics or explain survey limitations. To counter this bad habit, I share here details of our survey:
- Firm Sizes and Locations: Most respondents are from firms with 500 or more lawyers in the US, Canada, or the UK.
- Survey Not Representative of Market. We survey large law firms where we have identified senior KM professionals. Consequently, the survey selects for firms with a KM commitment. We believe results reasonably reflect the direction of KM for those firms but not necessarily the entire market.
- Respondents Provide Free-Form Text Answers and Tag Answers: Respondents answer each question with free-form text and tag their answers into one or more of 16 defined topics (tags). In 2016, we used the same tags as in 2015. In 2014, we had one additional tag, which we have dropped from the analysis. The list of tag names follows; for purposes of charts below, I abbreviate tag names:
- AFA / Budget / LPM
- Client-Facing KM (except expert systems)
- Collaboration
- Content management / document management software
- eDiscovery / litigation support
- Expert systems
- Experience location
- Forms, precedents & document assembly
- Matter management
- Portal re-design or upgrade
- Process improvement
- Security / access management / info. gov.
- Search (install, upgrade, or improve)
- Selling / marketing KM internally
- Social media / Enterprise 2.0
- Year-to-Year Comparisons May Be Unreliable:
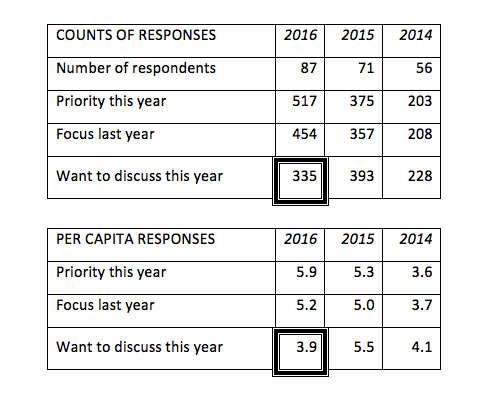
- For the 2016 survey, 87 KM professionals responded versus 71 in 2015 and 56 in 2014. Because the number and mix of respondents change annually, year-to-year results do not compare identical populations. Consequently, drawing definitive conclusions about trends is risky
- We allow multiple tags per answer and many respondents, in fact, chose several tags per question. That means percentages across tags do not add up to 100. Moreover, respondents select a considerable different number of tags each year, which makes longitudinal comparisons even more risky. The tables below present the number of respondents, tag counts, and per capita responses by year. Note especially the drop in the per capita “Discuss” in 2016.
2 Survey Results and Interpretation
This chart shows responses to the 2016 survey:
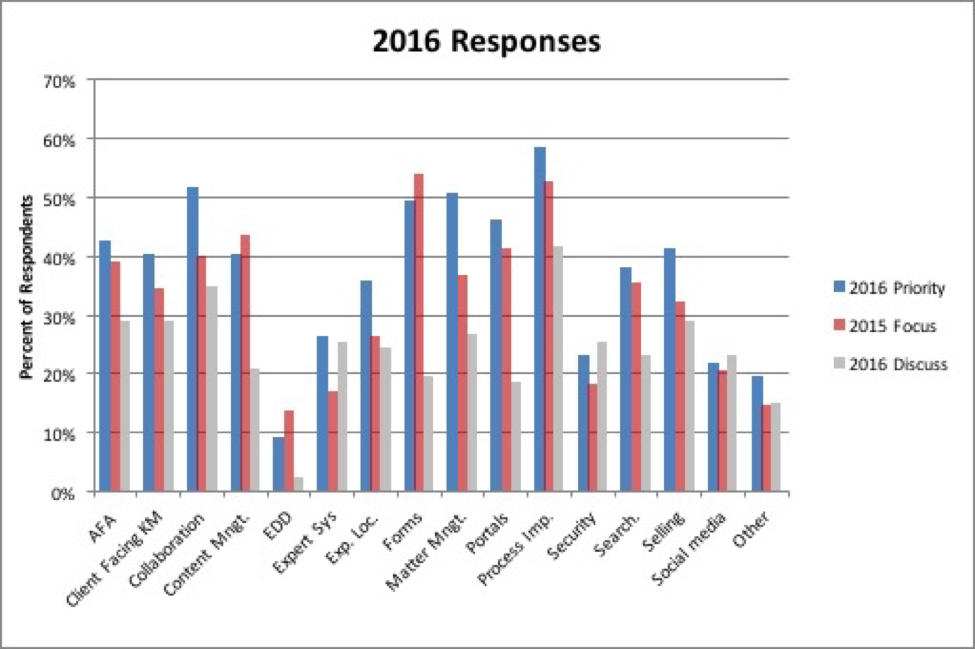
The variation in percent of respondents across Priority and Focus strikes me as relatively small relative to prior years. That is, if these data reflect actual plans and intent, then what respondents do in 2016 will not differ all that much from 2015.
As noted in Survey Demographics above, respondents this year tagged many fewer choices for Discuss (335) than for Priority (517) and Focus (454). Arithmetically therefore, the Discuss percentages are lower.
As for the relatively smaller number of responses to Discuss, I suppose one could surmise that this group is focusing its attention more tightly. My confidences in that conclusion, however, is limited and any other inferences would, I think, be even more speculative.
The chart below offers a longitudinal view, comparing priorities across three years:
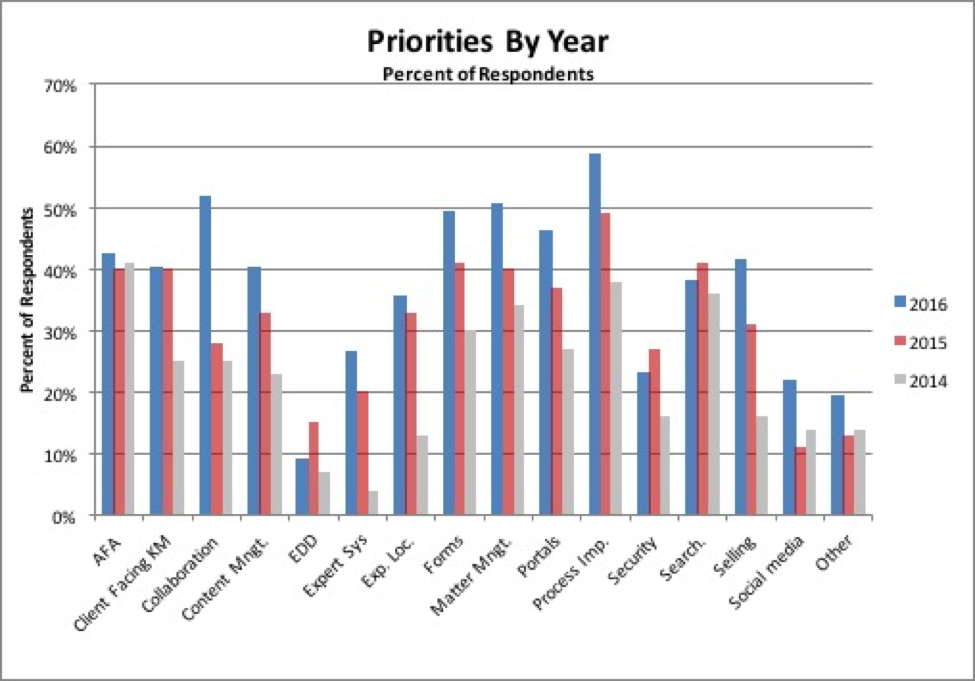
Reviewing this, I immediately noticed significant increases this year across most topics versus last year. We must dig deeper into the numbers to understand the year over year comparison. This year, the number of Priority tags per respondent is up significantly:
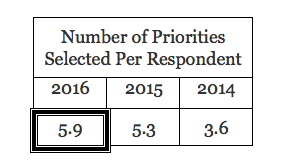
Again, it is arithmetically necessary that the percentages (on average) therefore be greater this year. So we cannot read much, if any, meaning into the chart above.
To overcome this limit, we can compare priorities in an ordinal ranking: instead of comparing percentages, we can compare where each tag ranked in the number of times respondents selected it. For the chart below, higher numbers mean higher priority. (This reverses the usual assumption that the highest priority would be #1. The visual effect of graphing it that way is hard to interpret.)
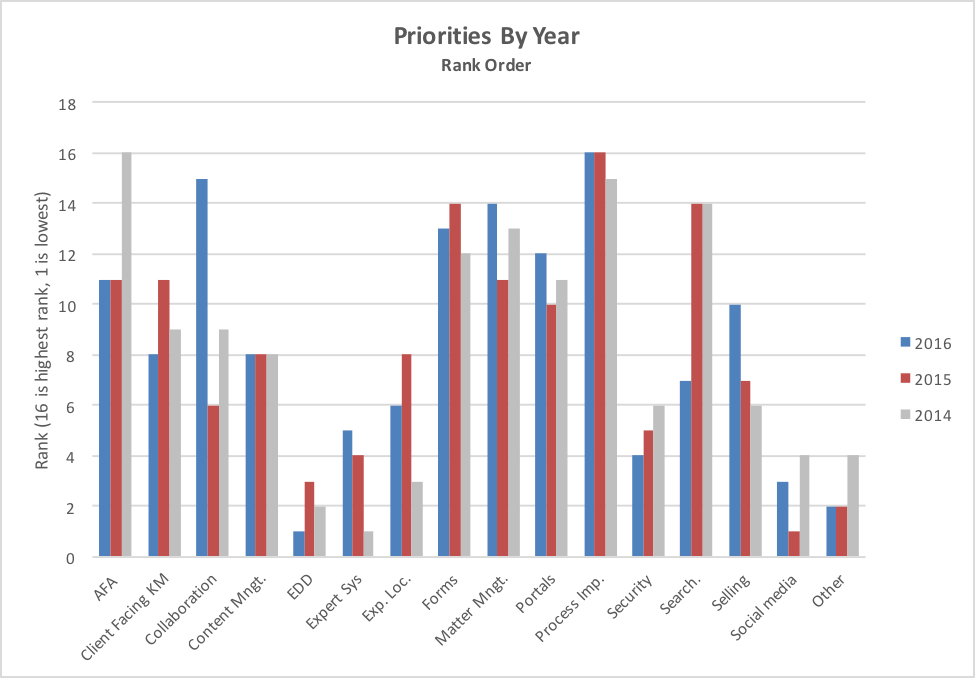
Viewed on this basis, the priorities appear more stable over time. Here’s my interpretation of high priorities (8 or above) with significant variances:
AFA remain a hot Big Law topic. The drop of KM focus on it likely reflects the rise of pricing professionals, which has shifted where responsibility lies.
Collaboration: I can only offer a weak and speculative interpretation here. Perhaps we have forgotten the failure of the first round of deploying collaboration tools. With memories short or optimism high, some may be ready to try again. Or perhaps the tools have improved (though process and culture remain more important than the tools).
Search: One explanation for the 2016 drop is that for respondents for whom it was a priority have rolled out search. If so, it is no longer a priority. I will speculate here to say that I think this will shift again in the next three years. With the advent of new tools for search, firms with mature products installed may consider swapping search engines as they make other changes to their IT stacks.
2.3 2015 Priorities Compared to Discussion Interests
Each year we also compare what respondents say they will actually do (priorities) with what they would like to discuss (talk). Because the number of discuss tags is lower this year than priorities, comparing percentages is inappropriate. Instead, we can compare the difference in rank orderings:
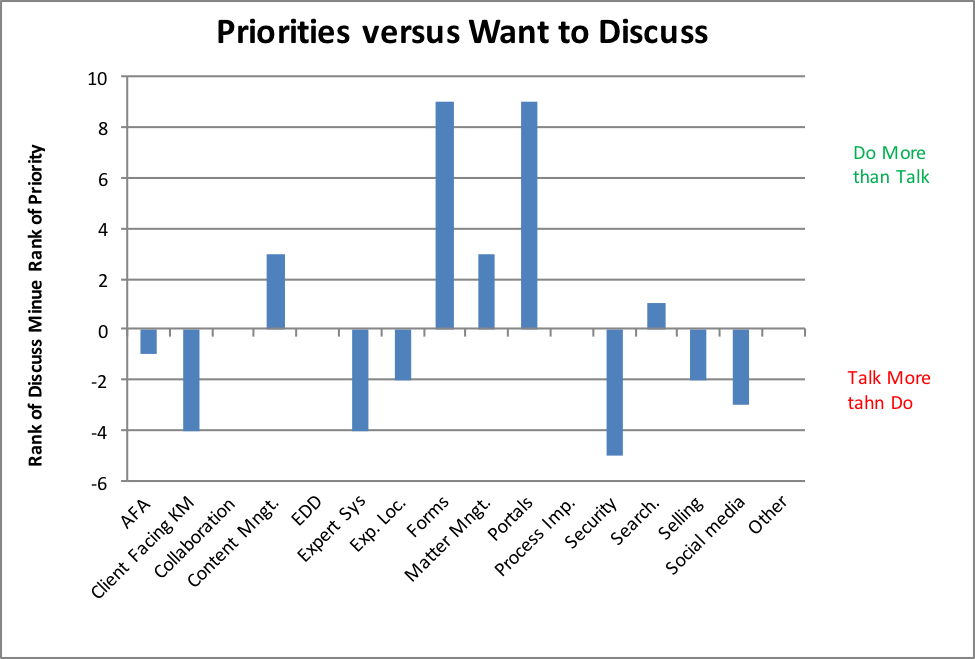
My simple and summary explanation for this is pattern is that “sex sells”. Most of the “Talk more than Do” tags are the perineal favorites: client-facing KM, expert systems, and social media. Many would like to do these but they have proven challenging, either because of cultural or economic issues. I can’t explain the result for security except perhaps to say it’s much easier to talk about it than work on it, especially if your focus is KM.
As for Do More than Talk, the tags here – content management, forms, matter management, and portals – are KM workhorses. These programs are more blocking and tackling than conceptually challenging so perhaps there is less need to discuss.
2.4 Other Findings: AI, Analytics, and Big Data
In the Discuss question, many respondents expressed interest in discussing artificial intelligence (AI), Big Data, and analytics. We did not offer tags for such comments so we cannot say how much activity exists around them. Next year, we will include at least two new tags to cover these topics. Given what I view as a high hype factor around these topics, my inclination is to add another a question (free text) to ask for explanations of AI or Big Data tags. It will be interesting to learn what firms are actually doing rather than just considering.
* * *
I welcome comments on whether the findings here comport with other surveys or individual experience in large law firms.