| I report here on a recent privately-conducted knowledge management survey.
Survey Background and Questions. This survey is part of the preparation for a meeting of KM professionals to discuss KM trends, issues, and opportunities. The co-organizers (of which I am one) surveyed invitees about their KM priorities and interests. We asked three questions; the text in quotes corresponds to chart labels below:
Survey Demographics and Details. Here is important background information:
2014 Priorities This chart displays answers for 2014, collected in late 2013 and early 2014. The topics appear, left to right, ranked by 2014 priority. |
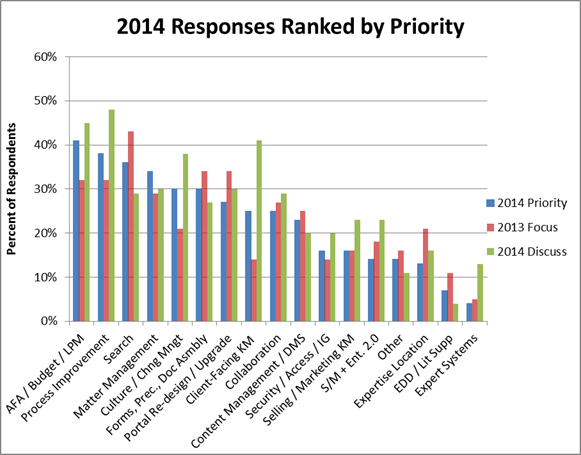 |
| These results confirm that KM professionals continue to focus on “new” (relative to a decade ago) priorities: alternative fees, budgeting, legal project management, and process management. That has been true for several years and, in my view, is likely to continue. Traditional KM, however, is not dead: search, matter management, forms and precedents, and portals continue to be important. |
| Note that we ask about four new topics this year: expert systems; portal re-design and upgrade; security, access, and information governance; and selling and marketing KM. Of these, respondents assigned portals the highest priority. The data do not, however, let us distinguish between “new and greater interest” versus “no change, we just never specifically asked previously.” That said, anecdotally, from my consulting practice, I do see a renewed interest in portal upgrades, driven in part by SharePoint 2013. |
| Did We Act on What We Said Our Priorities Would Be? |
| I compare here stated priorities for 2013 (collected in late 2012 and early 2013) with what respondents actually did in 2013 (reported in late 2013 and early 2014). The categories appear, left to right, ranked by size of gap between the two. |
 |
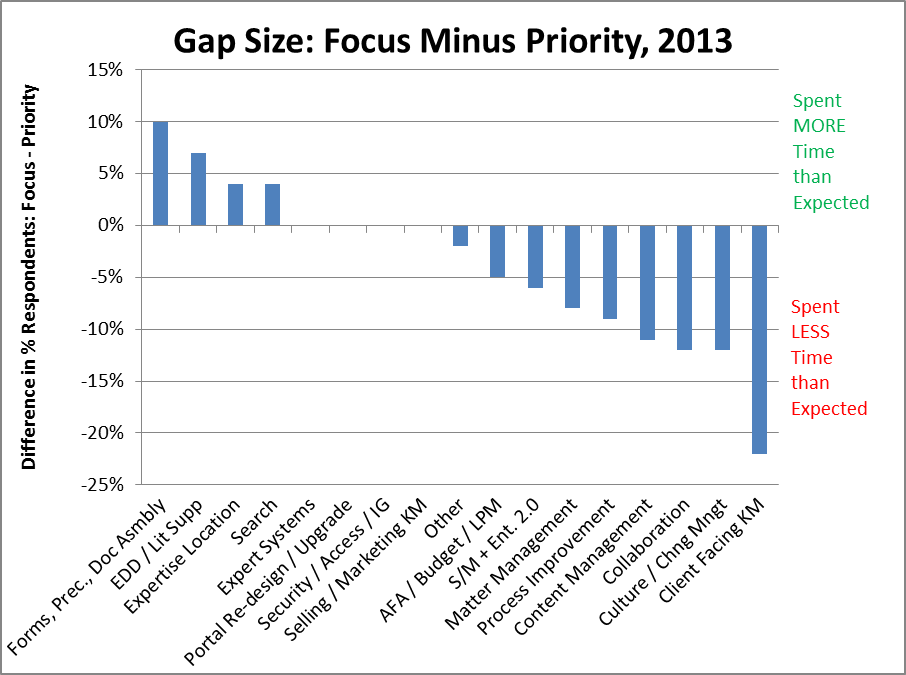 |
| The gap analysis this year is quite different than the gap analysis I conducted last year. For reference, here is the comparable chart from last year: |
 |
| Last year we saw gaps on AFA, budgets, LPM, and process improvement. That is, in 2012, respondents spent more time on these topics than they had expected to. That reversed in 2013, with respondents spending less time than expected on these. The conclusion I draw is that respondents have adjusted their expectations. We cannot say from these data how much time people actually spend on each priority. |
| The one consistent finding (and this is true even before 2012) is the respondents keep expecting (hoping?!?) to spend time on client-facing KM system but then do not. As for other topics, the 2013 gaps are generally not big enough to draw conclusions in my opinion. |
| 2014 Priorities Compared to Discussion Interests |
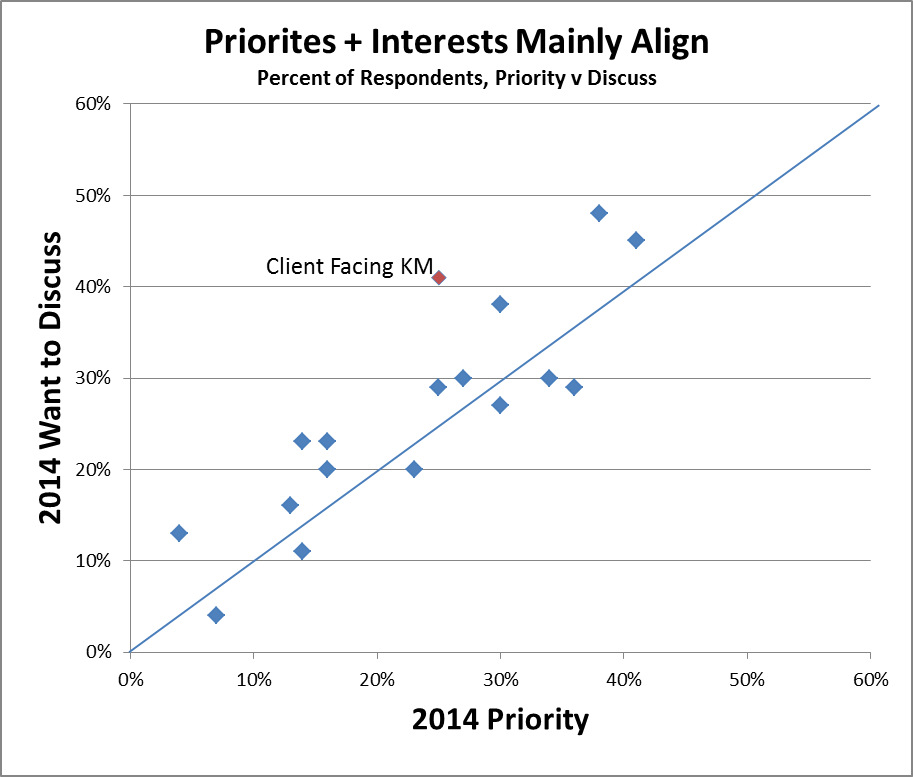
| The scatter chart below shows how 2014 priorities compare with discussion interests. Most topics lie close to the diagonal line, meaning the priority and interest in discussing align closely. Highlighted in red is one topic that deviates significantly from the diagonal: client-facing KM. This outcome is consistent with the findings I report above (discussion interest exceeds priority). The equivalent graph last year had four topics with significant divergence. To me, this is further evidence that expectations and actions are more closely aligned this year. |
 |
| Priorities Across Years |
The chart below compares priorities across three years of roughly comparable data. (Missing data means a question is new versus the prior year.) Several points flow from this comparison:
|
 |
| End Notes |
| 1. These results reflect a subset of the large law firm market. Please comment if you have questions or if you believe the results do not reasonably reflect what is really happening. |
| 2. This survey, like almost all I have seen in the legal market, has limitations. I strove to clearly explain the survey limits and demographics (subject to confidentiality constraints). As you evaluate other market surveys, remember to look for information on survey demographics and qualifiers regarding multiple v single choice answers and comparisons of year-to-year responses. Sadly, I have found that even (especially?) companies in the business of doing surveys publish results that fail to provide this critical information. |